

King County's median sale price was $879,500 in July 2026, up 0.51% year over year, while active listings rose 23.65% to 7,836 (Northwest MLS, July 2026). More supply, flat prices. That combination is the whole story of the Seattle suburbs this year, and it lands very differently depending on which suburb you're looking at.
Guides to Seattle's suburbs tend to describe them. This one measures them. Every figure below comes from the Northwest MLS King County breakout for July 2026, the same report brokers work from, with the year-over-year comparison alongside it.
KEY TAKEAWAYS
- King County's July 2026 median was $879,500, up 0.51% year over year, with active listings up 23.65%.
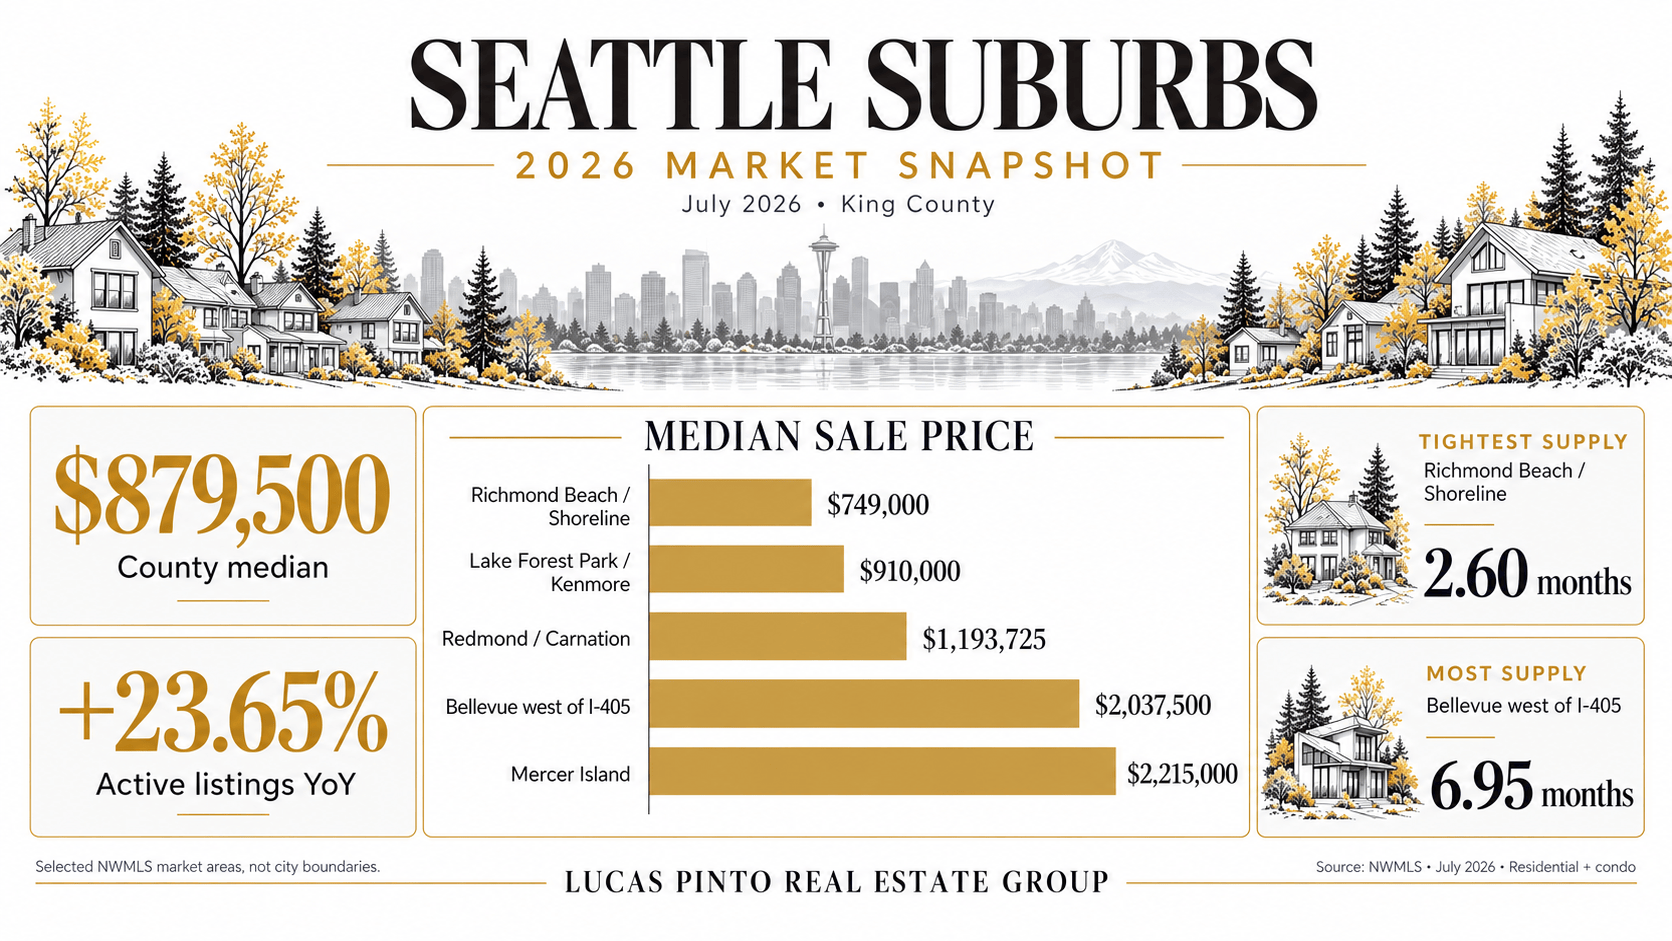
- Suburban medians range from $749,000 in the Richmond Beach/Shoreline area to $2,215,000 on Mercer Island a three-fold spread.
- Inventory grew everywhere, but unevenly: up 9.64% around Shoreline, up 66.46% east of Lake Sammamish.
- The 2 Line light rail extension opened fully on 28 March 2026, changing Eastside commute options for the first time in decades.
How do Seattle's suburbs compare on price and inventory?
Here is the July 2026 data, sorted from lowest median to highest. All figures are residential-plus-condo sales from the Northwest MLS King County breakout.
| NWMLS REPORTING AREA | MEDIAN SALE PRICE | YOY PRICE | ACTIVE LISTINGS | YOY LISTINGS | MONTHS OF INVENTORY |
|---|---|---|---|---|---|
| Richmond Beach / Shoreline | $749,000 | −8.66% | 91 | +9.64% | 2.60 |
| West Seattle | $864,000 | +8.27% | 337 | +15.02% | 2.83 |
| Lake Forest Park / Kenmore | $910,000 | −6.52% | 112 | +72.31% | 4.87 |
| Juanita / Woodinville | $1,150,000 | −1.29% | 567 | +24.07% | 4.11 |
| Redmond / Carnation | $1,193,725 | +4.94% | 269 | +32.51% | 5.85 |
| East of Lake Sammamish | $1,347,000 | −6.75% | 546 | +66.46% | 3.77 |
| Bellevue east of I-405 | $1,395,000 | −5.58% | 311 | +16.04% | 4.26 |
| East Side south of I-90 | $1,512,500 | +3.60% | 312 | +42.47% | 3.47 |
| Kirkland / Bridle Trails | $1,670,000 | +0.45% | 407 | +27.99% | 4.73 |
| Bellevue west of I-405 | $2,037,500 | −13.08% | 292 | +47.47% | 6.95 |
| Mercer Island | $2,215,000 | −13.98% | 83 | +18.57% | 2.86 |
| All King County | $879,500 | +0.51% | 7,836 | +23.65% | 3.88 |
| Eastside subtotal | $1,378,000 | −1.57% | 2,787 | +35.23% | 4.29 |
| Seattle subtotal | $884,500 | +0.57% | 2,700 | +14.36% | 3.96 |
An important caveat on geography. NWMLS reports by map area, not by city limits, and the two are not the same thing. Bellevue splits across two areas either side of I-405. Area 560 covers Kirkland together with Bridle Trails, which is why its median runs well above the city of Kirkland figure you'll see quoted elsewhere. Bothell straddles the King–Snohomish County line and doesn't appear as a single King County area at all.
Rows are labelled by what NWMLS actually reports. Treat them as market areas, not as municipal boundaries.
What is "months of inventory," and why does it matter more than price?
Months of inventory is how long the current listings would take to sell at the current pace. It is the clearest single measure of who holds leverage.
The working convention brokers use: under three months favours sellers, three to six is roughly balanced, and above six favours buyers.
Apply that to the table and the picture stops being about price at all:
- Richmond Beach/Shoreline (2.60) and West Seattle (2.83) are still tight. Fewer listings, faster turnover, less room to negotiate.
- Mercer Island sits at 2.86 despite the county's highest median expensive and still short of supply.
- Bellevue west of I-405 (6.95) and Redmond/Carnation (5.85) have crossed into buyer territory.
That last point is the one worth sitting with. The most expensive area on the list outside Mercer Island is also the one where buyers have the most leverage. Price level and negotiating position are different questions, and the table answers both separately.
Where has buyer choice grown most?
Inventory rose in every area, but the spread is enormous from 9.64% to 72.31%.
| AREA | ACTIVE LISTINGS, JULY 2026 | CHANGE VS JULY 2025 |
|---|---|---|
| Lake Forest Park / Kenmore | 112 | +72.31% |
| East of Lake Sammamish | 546 | +66.46% |
| Bellevue west of I-405 | 292 | +47.47% |
| East Side south of I-90 | 312 | +42.47% |
| Redmond / Carnation | 269 | +32.51% |
| Kirkland / Bridle Trails | 407 | +27.99% |
| Juanita / Woodinville | 567 | +24.07% |
| Bellevue east of I-405 | 311 | +16.04% |
| West Seattle | 337 | +15.02% |
| Richmond Beach / Shoreline | 91 | +9.64% |
The Eastside as a whole added 35.23% more active listings year over year, against 14.36% for Seattle proper. If you shopped the Eastside in 2025 and stopped because there was nothing to see, the inventory position is materially different now.
Two areas show a pattern worth naming: east of Lake Sammamish and Bellevue west of I-405 combine large inventory increases with falling medians (−6.75% and −13.08%). More supply and softer pricing at the same time is the clearest buyer-favourable signal in the county.
What is demand doing while supply rises?
Inventory is only half the equation. The other half is whether buyers are transacting, and across King County in July 2026 they were doing less of it: pending sales fell 13.49% year over year and closed sales fell 11.93%.
| AREA | PENDING SALES, YOY | CLOSED SALES, YOY |
|---|---|---|
| Redmond / Carnation | −32.43% | −34.29% |
| Bellevue east of I-405 | −28.26% | −20.65% |
| Kirkland / Bridle Trails | −23.58% | −2.27% |
| Bellevue west of I-405 | −19.64% | −12.50% |
| Richmond Beach / Shoreline | −11.36% | +12.90% |
| West Seattle | −8.89% | −15.00% |
| East of Lake Sammamish | −1.32% | −7.05% |
| All King County | −13.49% | −11.93% |
| Eastside subtotal | −17.34% | −13.70% |
| Seattle subtotal | −17.58% | −12.56% |
Rising supply and falling transaction volume at the same time is what produces the months-of-inventory numbers in the first table. It also explains why medians are flat rather than falling hard: sellers are listing, buyers are slower to commit, and the homes that do sell are still clearing near asking.
Redmond/Carnation is the outlier worth flagging. Its median rose 4.94% while pending sales fell 32.43% and closed sales fell 34.29% a rising price on sharply thinner volume. That is a composition effect, not a hot market, and it's the kind of number that misleads if you read only the price column.
What changed for Eastside commutes in 2026?
The single largest change to how these suburbs connect to Seattle happened this year, and guides written before spring 2026 do not reflect it.
The 2 Line light rail extension opened fully on 28 March 2026, connecting the Eastside to downtown Seattle across Lake Washington including the first light rail service anywhere to run on a floating bridge. Published rider guidance puts Bellevue Downtown at roughly 22 minutes from International District/Chinatown, and Downtown Redmond at roughly 41 minutes.
For a buyer this reframes the Eastside premium. Bellevue and Redmond now have a fixed-rail connection to Seattle that Sammamish, Issaquah, Bothell and Shoreline do not. Where that matters, it is worth real money; where you drive anyway, it is worth nothing.
West Seattle is on the opposite side of that trade. Its light rail extension is in design, with construction running 2027 to 2035 and start of service targeted for 2035, per Sound Transit's published timeline. Buyers there are looking at a decade of construction before the benefit arrives.
Which Seattle suburb is the most affordable?
Of the areas in this comparison, Richmond Beach/Shoreline is the lowest at a $749,000 median, down 8.66% year over year the only area on the list combining the lowest price with a falling median.
Below that, King County's south-end areas run cheaper still. The NWMLS breakout puts the southwest King subtotal at a $625,000 median and southeast King at $690,000, both flat year over year. Those areas sit further from Seattle and outside the eight suburbs usually named in guides like this one, but if price is the binding constraint, that is where the county's supply actually is.
How the eight most-discussed suburbs sit in this data
Bellevue splits at I-405: $1,395,000 to the east, $2,037,500 to the west, with the western half at 6.95 months of inventory the most buyer-favourable position in the county.
Kirkland, reported with Bridle Trails, posted the highest non-island median at $1,670,000, essentially flat year over year at +0.45%.
Redmond, reported with Carnation, was one of only three areas with a rising median (+4.94%) and sits at 5.85 months of inventory.
Sammamish and Issaquah fall within the East of Lake Sammamish and East Side south of I-90 areas $1,347,000 and $1,512,500 respectively, with the former posting the county's second-largest inventory increase at +66.46%.
Bothell spans the King–Snohomish line and is not a single King County reporting area, so county-level figures understate it. Ask for the Snohomish breakout alongside the King one before drawing conclusions.
Shoreline, reported with Richmond Beach, is the lowest-priced and tightest-supplied area here: $749,000 at 2.60 months.
West Seattle was the strongest price performer in the comparison at +8.27%, with 2.83 months of inventory inside Seattle city limits rather than a suburb, and priced closer to the county median than to the Eastside.
How should you use this table?
Work from the constraint that actually binds you, in this order.
- Price first. The table spans $749,000 to $2,215,000. That range decides which rows are live options and which are not, before anything else matters.
- Then leverage. Months of inventory tells you how much room you have to negotiate. A 6.95-month area and a 2.60-month area call for completely different offer strategies at the same price point.
- Then the commute you will actually make. Rail access is a real, permanent difference between Bellevue and Redmond and everywhere else on this list. If you drive daily, it changes nothing.
- Then direction of travel. An area with a falling median and rising inventory is negotiating differently than one with a rising median and tight supply, even where today's prices match.
Want the current numbers for a specific address rather than a market area? Area medians tell you position; only comparable sales tell you value.
Frequently Asked Questions
What are the best suburbs of Seattle to live in?
There is no single answer, because the areas differ most on price and supply rather than on any ranking. July 2026 medians ranged from $749,000 around Richmond Beach/Shoreline to $2,215,000 on Mercer Island, with months of inventory from 2.60 to 6.95. Match the area to your budget and your commute, then compare on the data.
What is the most affordable suburb of Seattle?
Among the areas compared here, Richmond Beach/Shoreline had the lowest median at $749,000 in July 2026, down 8.66% year over year. Looking wider, NWMLS reported a $625,000 median for southwest King County and $690,000 for southeast King County, both further from Seattle.
What cities are on the outskirts of Seattle, Washington?
The commonly discussed ring includes Bellevue, Kirkland, Redmond, Sammamish, Issaquah and Bothell on the Eastside, Shoreline and Lake Forest Park to the north, and Renton, Kent and Burien to the south. West Seattle is often grouped with them but sits inside Seattle city limits.
How much have Seattle suburb home prices changed in 2026?
Unevenly. King County's median rose 0.51% year over year to $879,500 in July 2026. Within that, West Seattle rose 8.27% and Redmond/Carnation 4.94%, while Bellevue west of I-405 fell 13.08% and Mercer Island fell 13.98%. County averages hide the spread.
Is inventory increasing in the Seattle suburbs?
Yes, substantially. King County active listings rose 23.65% year over year to 7,836 in July 2026, and the Eastside rose 35.23%. The largest single increase was Lake Forest Park/Kenmore at 72.31%. Every area in this comparison had more listings than a year earlier.
Sources
Sourcing note. All price, listing, and inventory figures are from the Northwest MLS King County breakout report for July 2026, retrieved directly. NWMLS reports by map area rather than city limits; area definitions are per the published NWMLS King County area key. Light rail travel times are as published in rider guidance and are secondary.
- • Northwest Multiple Listing Service, Breakouts: King Map Areas, July 2026, retrieved directly 2026-08-22, https://www.nwmls.com/wp-content/uploads/2026/08/Breakouts_King-July2026.pdf
- • Northwest Multiple Listing Service, Market Snapshot July 2026, retrieved directly 2026-08-22, https://www.nwmls.com/market-snapshot-july-2026/
- • NWMLS King County map area definitions, https://seattlebubble.com/blog/nwmls-kc-breakouts/
- • Sound Transit, West Seattle Link Extension Timeline and milestones, retrieved directly 2026-08-22, https://www.soundtransit.org/system-expansion/west-seattle-link-extension/timeline-milestones

Check out this article next